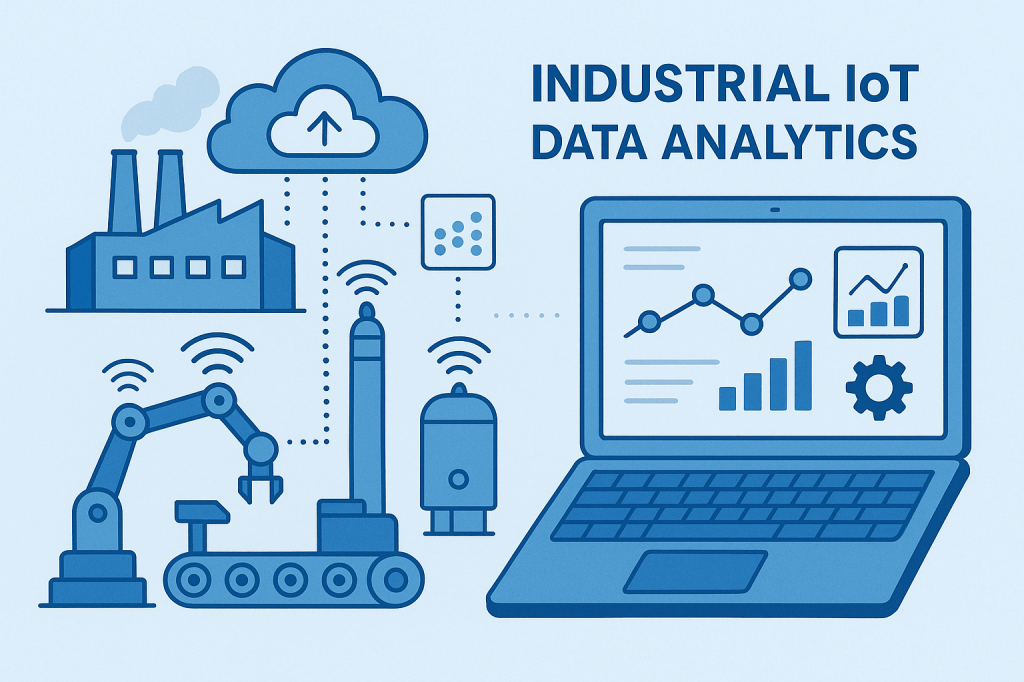
Industrial IoT (IIoT) Data Analytics harnesses the power of connected sensors, devices, and machines to collect real-time operational data and turn it into actionable insights. By integrating advanced analytics, artificial intelligence, and machine learning with industrial systems, IIoT analytics enables organizations to monitor equipment health, optimize production processes, reduce downtime, and improve decision-making.
From predictive maintenance and anomaly detection to energy optimization and process efficiency, IIoT analytics transforms raw data into strategic value—driving smarter operations, increased reliability, and measurable ROI. Click on this link to open a report on IIoT Data Analytics.
Problems That are Solved
- Real time condition monitoring of rotating machines including motors, gearboxes, fans, pumps.
- Abnormal pattern detection in OT data
- Real time anomaly detection in batch processes to identify issues early and preventing batch failure
How Is It Done ?
- Data are collected from existing systems like SCADA or sensors or IoT connectors.
- Depending upon the application suitable algorithms/approaches are used to develop data processing workflow and models.
- Analytics done either at cloud platform or on premise.
- Results presented via dashboards and charts.
End-to-end ML/Analytics Projects
| Step 1: Understand the real objectives and big picture Model building may not be the end goal! Who are the customers/users ? How are these models gonna be used ? Current approach/solution (if any), limitations, efforts, manual/automated ? Above points need to be clarified to frame the problem, algorithm options, performance metrics, efforts involved. With above details, data scientist can start designing framework and solution – unsupervised/semi/supervised/reinforcement learning Anomaly detection/classification/regression Bach learning or online Univariate or multivariate Performance measures options -Expert validation Different performance metrics depending upon problems – rmse, mae, etc. |
| Step 2: Get the data Where are the training data located – cloud buckets/computers How to access the data – direct download from cloud/api/offline Understand Metadata, data structure, data typesIs it raw data or processed or features only Note when you are dealing with varying data, offline access or download option may not be suitable as accessing all sorts of data will be time consuming. Its better to have a playground where you have access to all the data and you can run your codes. |
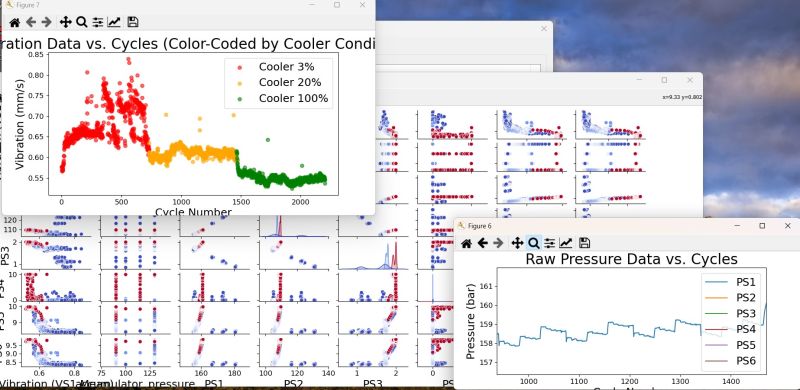
| Step 3: Exploratory data analysis In-depth study of distribution, trends, patterns, correlations using advanced visualization tools. Features derivation |
| Step 4: Data preparation Build Transformation and features functions Data filtering/cleaning/filling/Scaling |
| Step 5: Model training and selection Based on problem type – try out multiple model/algos/approaches Have a platform where multiple algorithms can be tried out and compared easily Cross validation Human-in-loop |
| Step 6: Model fine tuning Once models are shortlisted, fine-tuning is required Grid search for optimal hyperparameter Try ensemble methods (multi modal) Evaluate best performing models and errors Evaluate thoroughly Human-in-loop |
| Step 7: Solution presentation Start with big picture first Summarize and highlight what you have done Explain how this solution is gonna help business Share interesting findings/observations Highlight assumptions |
| Step 8: Deploy and monitor Connect with production data Monitoring system to track concept drift, performance degradation |
DOCUMENT ALL YOUR WORK WITH SUMMARIES.
Anomaly Detection in Time Series
Users can upload their IIoT time series data in CSV format, and the app automatically analyzes and highlights anomalous points.
Refer below link to try it out:
Anomaly detection is a critical field in data analysis focused on identifying patterns that deviate significantly from the expected behavior.
Types of Anomalies
Point Anomalies: Individual data instances that deviate significantly from the rest of the data. For example, a sudden spike in temperature reading from a machine sensor.
Contextual Anomalies: Data points that are anomalous in a specific context but not otherwise. For example, high vibration levels that are normal during startup but indicate a problem during steady-state operation.
Collective Anomalies: Collections of related data instances that are anomalous with respect to the entire dataset, while individual data points might not be anomalies by themselves. For example, a sequence of minor pressure fluctuations that together indicate an impending equipment failure.
Types of Employed Models
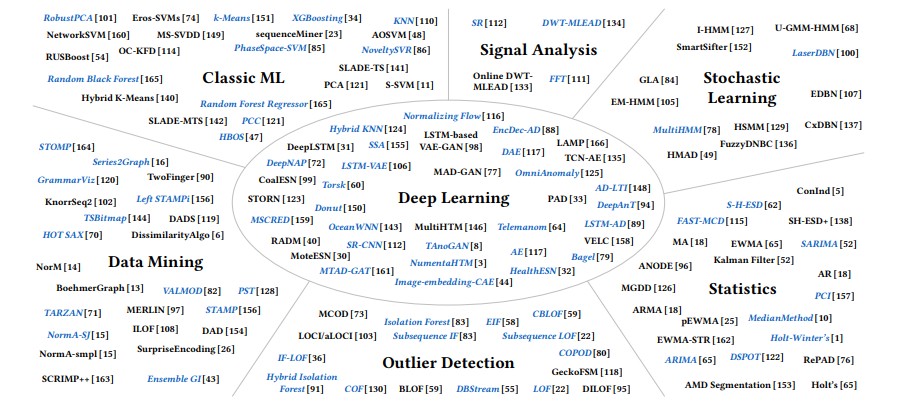
Reference – Schmidl, S., Wenig, P. and Papenbrock, T., 2022. Anomaly detection in time series: a comprehensive evaluation. Proceedings of the VLDB Endowment, 15(9), pp.1779-1797.
Linear Models: Simple and interpretable approaches like PCA, SVD; effective for lower-dimensional data with linear relationships
Statistical Models: Parametric approaches (t-tests, chi-square tests); distribution-based methods (Gaussian models)
Probabilistic Models: Bayesian networks, Hidden Markov Models (HMMs), Gaussian Mixture Models (GMMs)
Clustering-based: K-means, DBSCAN, Hierarchical clustering methods
Nearest-Neighbors-based: k-NN distance methods, Local Outlier Factor (LOF)
Density-based: DBSCAN, Isolation Forest
Deep-Learning-based: Autoencoders, Variational Autoencoders (VAEs), Generative Adversarial Networks (GANs), Long Short-Term Memory networks (LSTMs), Convolutional Neural Networks (CNNs)
Multi-modal approach – combines different algos like arima+lof to reduce false predictions.
Industrial Applications
Predictive Maintenance: Early detection of equipment degradation, Identification of unusual wear patterns, Prevention of catastrophic failures
Manufacturing Quality Control: Detecting defects in production lines, Identifying process deviations, Ensuring product consistency
Machine Performance Monitoring: Tracking efficiency metrics, Detecting suboptimal operation conditions, Optimizing operational parameters
Equipment Health Assessment: Vibration analysis in rotating machinery, Thermal pattern monitoring, Acoustic emission analysis
Process Control Systems: Detecting drift in chemical processes, Monitoring batch consistency, Identifying recipe deviations
Energy Consumption Optimization: Detecting inefficient energy usage patterns, Identifying equipment consuming excess power, Optimizing operational schedules
Safety Systems: Early warning of dangerous conditions, Detection of sensor malfunctions, Identification of operator errors
