Check out MCSA App:
Electrical signature analysis is a non-intrusive technique of condition monitoring of electrical equipment. Electrical signature analysis helps to assess power quality and faults in electrical and mechanical components by measuring current and voltage signals. This technique is capable of providing health status of drives, motors, as well as driven equipment like pumps, compressors, etc.
ESA is suitable for the applications where equipment is not easily accessible for instrumentation, for example, nuclear plants, wastewater treatment plants, etc.
How its Done ?
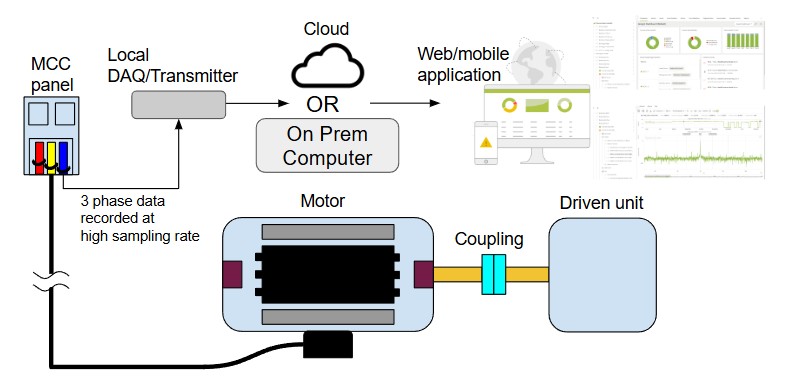
A significant advantage of this technique is their non-intrusive nature. Data acquisition typically occurs at the Motor Control Center (MCC), often located at a safe distance from the motor itself. This eliminates the need to install sensors directly on the machinery, which can be hazardous, inaccessible, or require a shutdown
The process involves:
- Data Capture: Current transformers (CTs) and, for ESA, additional voltage probes are connected to the motor’s power cables within the MCC. These sensors capture the real-time electrical signals (at sufficient sampling rate, typical Fmax is 50th harmonic of line frequency).
- Signal Processing: The captured analog signals are then digitized and subjected to various signal processing techniques. This is where the “signature” is extracted and analyzed.
- Fast Fourier Transform (FFT): Similar to vibration analysis, this is a cornerstone of ESA. FFT converts the time-domain current (and voltage) signals into the frequency domain. This allows for the identification of specific frequency components associated with different mechanical and electrical phenomena within the motor and the driven unit (pump, fan, belt, gearbox, etc.).
- Windowing: To improve the accuracy of the FFT, windowing functions are applied to the sampled data. This minimizes spectral leakage, an effect that can obscure important frequency components.
- Demodulation: Its well known that the primary and dominant frequency component is the line frequency (50 or 60 Hz, depending on geographical location). Faults cause change in current drawn, esp. modulation. With demodulation, analysts can focus on only the modulating frequencies, which are fault frequencies.
- dB Scale Representation: The amplitudes of the frequency components are often displayed on a decibel (dB) scale, typically referenced to the amplitude of the line frequency (e.g., 50 Hz or 60 Hz). The line frequency peak is set as 0 dB, and the amplitudes of fault-related frequencies are then measured as “dB down” from this reference. This logarithmic scale allows for a wide dynamic range, making it easier to identify small-amplitude fault signals.
By analyzing the patterns and amplitudes of these characteristic frequencies, trained analysts or automated systems can identify a wide range of potential issues, including rotor bar faults, bearing degradation, stator winding faults, misalignment, unbalance, and even problems with the driven load.
Calculation and Signal Processing
The extent of diagnostic information obtainable depends on the specific measurements taken:
- Single-Phase Current Measurement (CSA):
- FFT Analysis: Even with just one phase of current, FFT analysis can reveal characteristic fault frequencies. This allows for basic fault diagnosis, identifying issues like broken rotor bars.
- Limitations: Without all three phases, conditions like current imbalance cannot be directly assessed, and distinguishing between motor faults and supply issues can be more challenging.
- Three-Phase Current Measurement (CSA):
- Current Imbalance Calculation: A critical diagnostic parameter, current imbalance, can be precisely calculated. Imbalance can indicate issues with the power supply, stator windings, or connections, and it leads to increased motor heating and reduced efficiency. The formula for percent current imbalance is often calculated as: Percent Imbalance=(Maximum Current Deviation from Average Current/Average Current)×100%
- This provides a clearer indication of electrical stress on the motor.
- Current and Voltage Measurement (ESA):
- Enhanced Diagnostics: Measuring both current and voltage significantly enhances diagnostic capabilities.
- Phase Analysis: The phase relationship between voltage and current (power factor) can be determined for each phase. Deviations can indicate inefficiencies or specific fault conditions.
- Impedance Calculation: By knowing both voltage (V) and current (I), the impedance (Z=V/I) of the motor circuit can be calculated and trended. Changes in impedance can signal developing faults like winding shorts or degradation.
- Input Supply Issue Diagnosis: ESA allows for a clear distinction between problems originating in the motor itself versus those stemming from the input power supply. Voltage imbalances, harmonic distortion in the voltage waveform, and other power quality issues can be readily identified and quantified.
- Improved Fault Localization: The additional information from voltage signatures helps in more accurately pinpointing the root cause of a fault, reducing diagnostic ambiguity. For example, specific harmonic content in the voltage can point directly to issues with upstream transformers or power factor correction capacitors.
In summary, Current and Electrical Signature Analysis offer a sophisticated, remote, and data-driven approach to machinery condition monitoring. By carefully capturing and processing the electrical bloodline of a motor, these techniques provide invaluable insights, enabling proactive maintenance and enhancing operational reliability. The choice between CSA and ESA often depends on the criticality of the equipment, the desired level of diagnostic detail, and budgetary considerations, with ESA generally providing the most comprehensive assessment.
